I have visualised…
why the news was making me stressed,

motion capture data of dance movements,


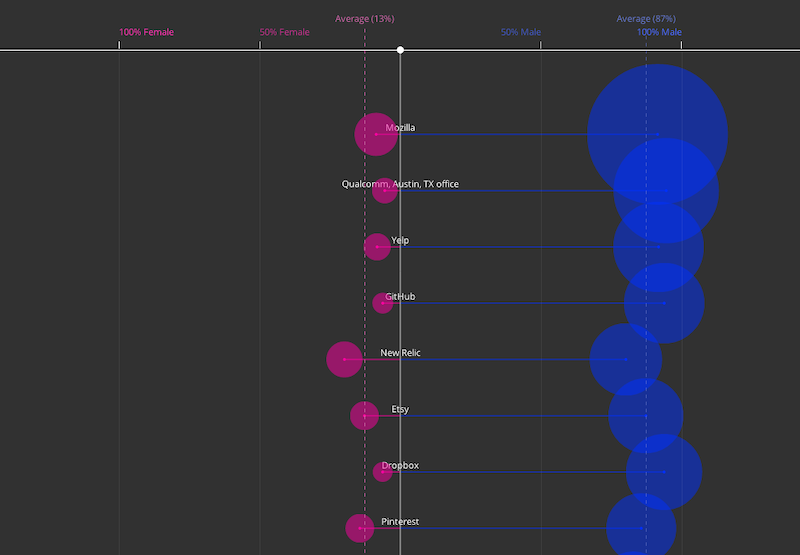
the number of male tech employees compared to female tech employees,
the flow of financial aid from China to Africa,
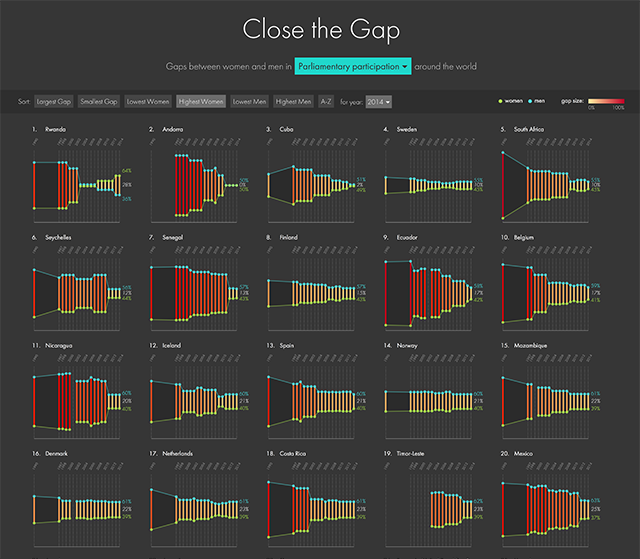
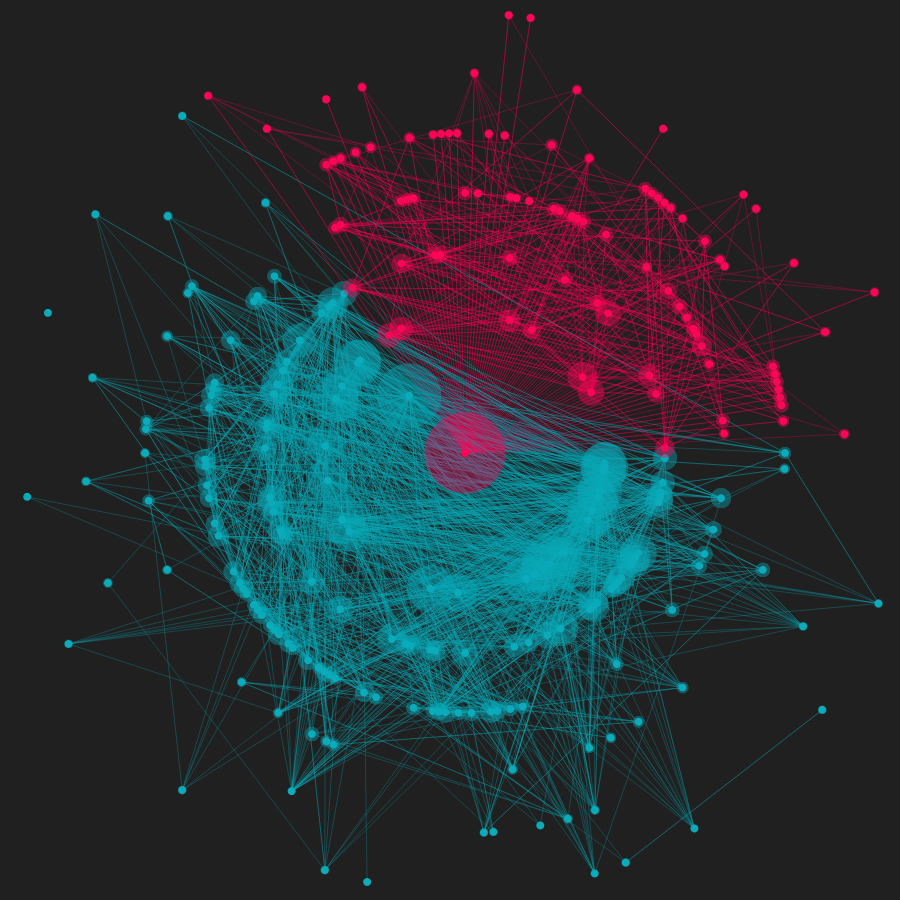
the complexities of gender in my twitter network,
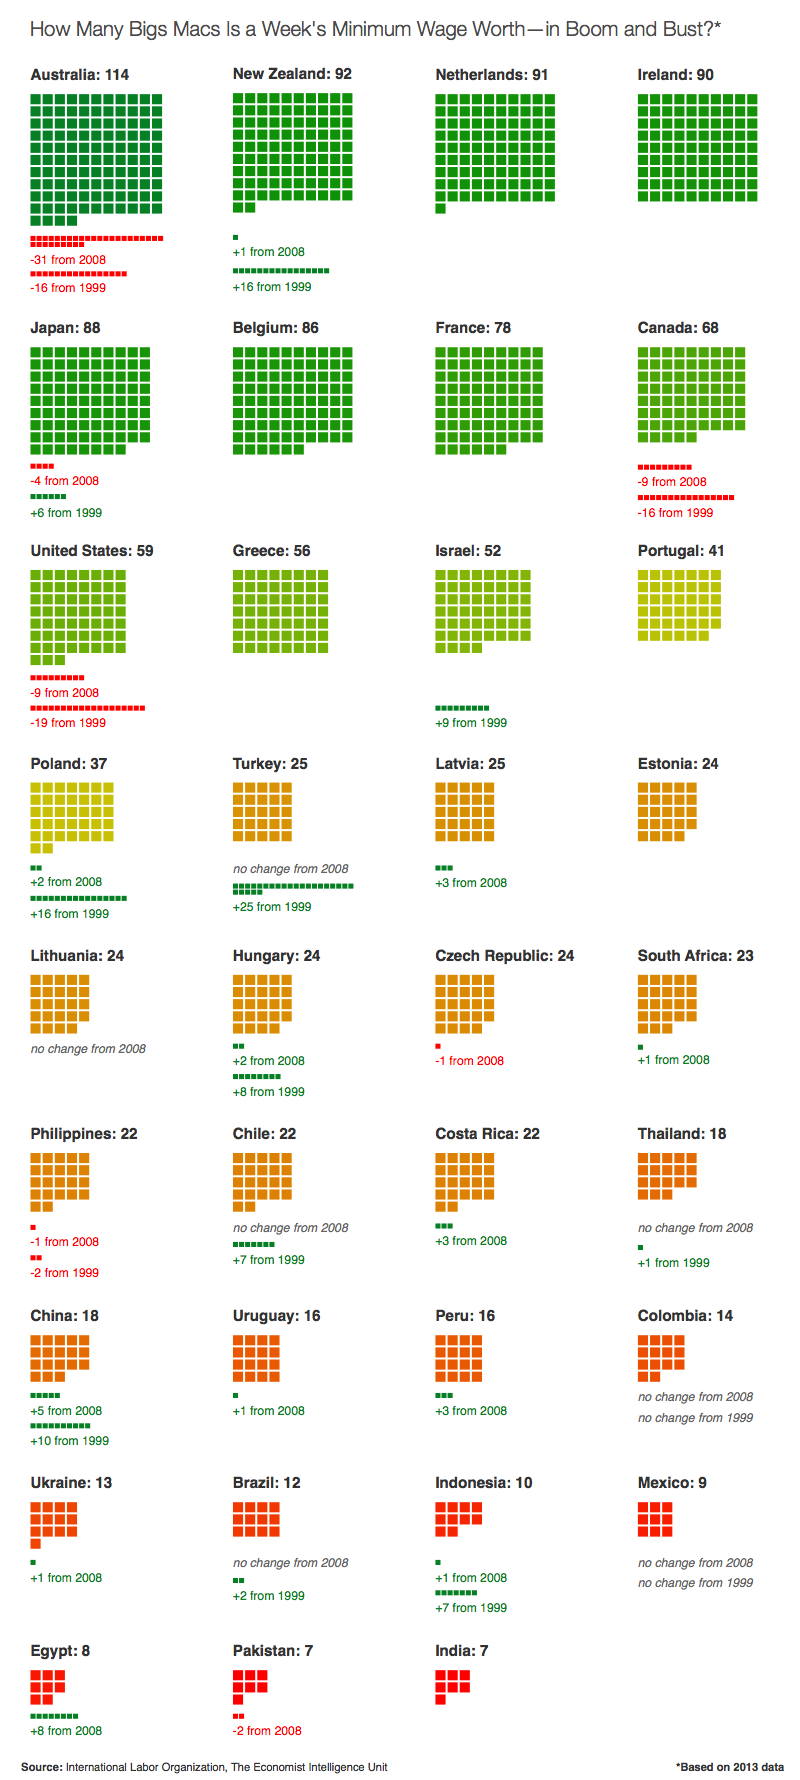
how wages around the world compare in terms of Big Macs,
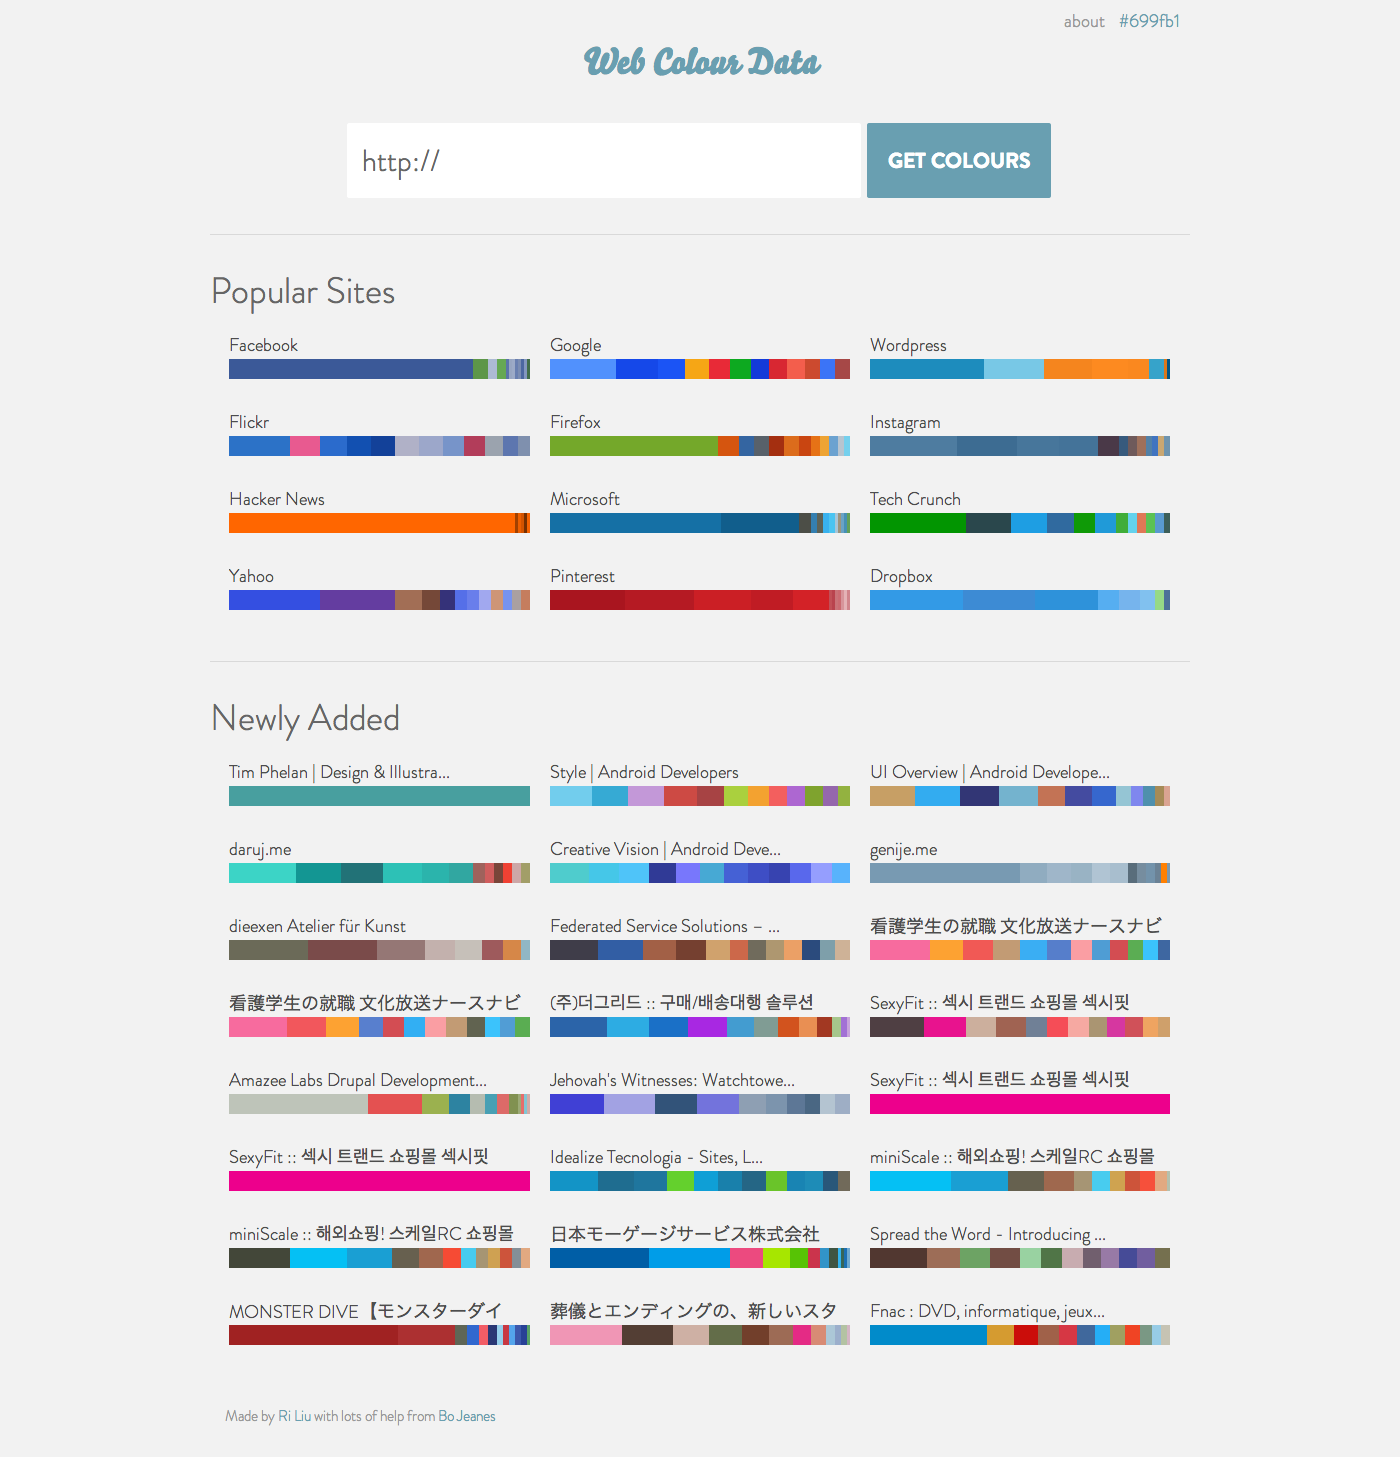
and the colour composition of any website.